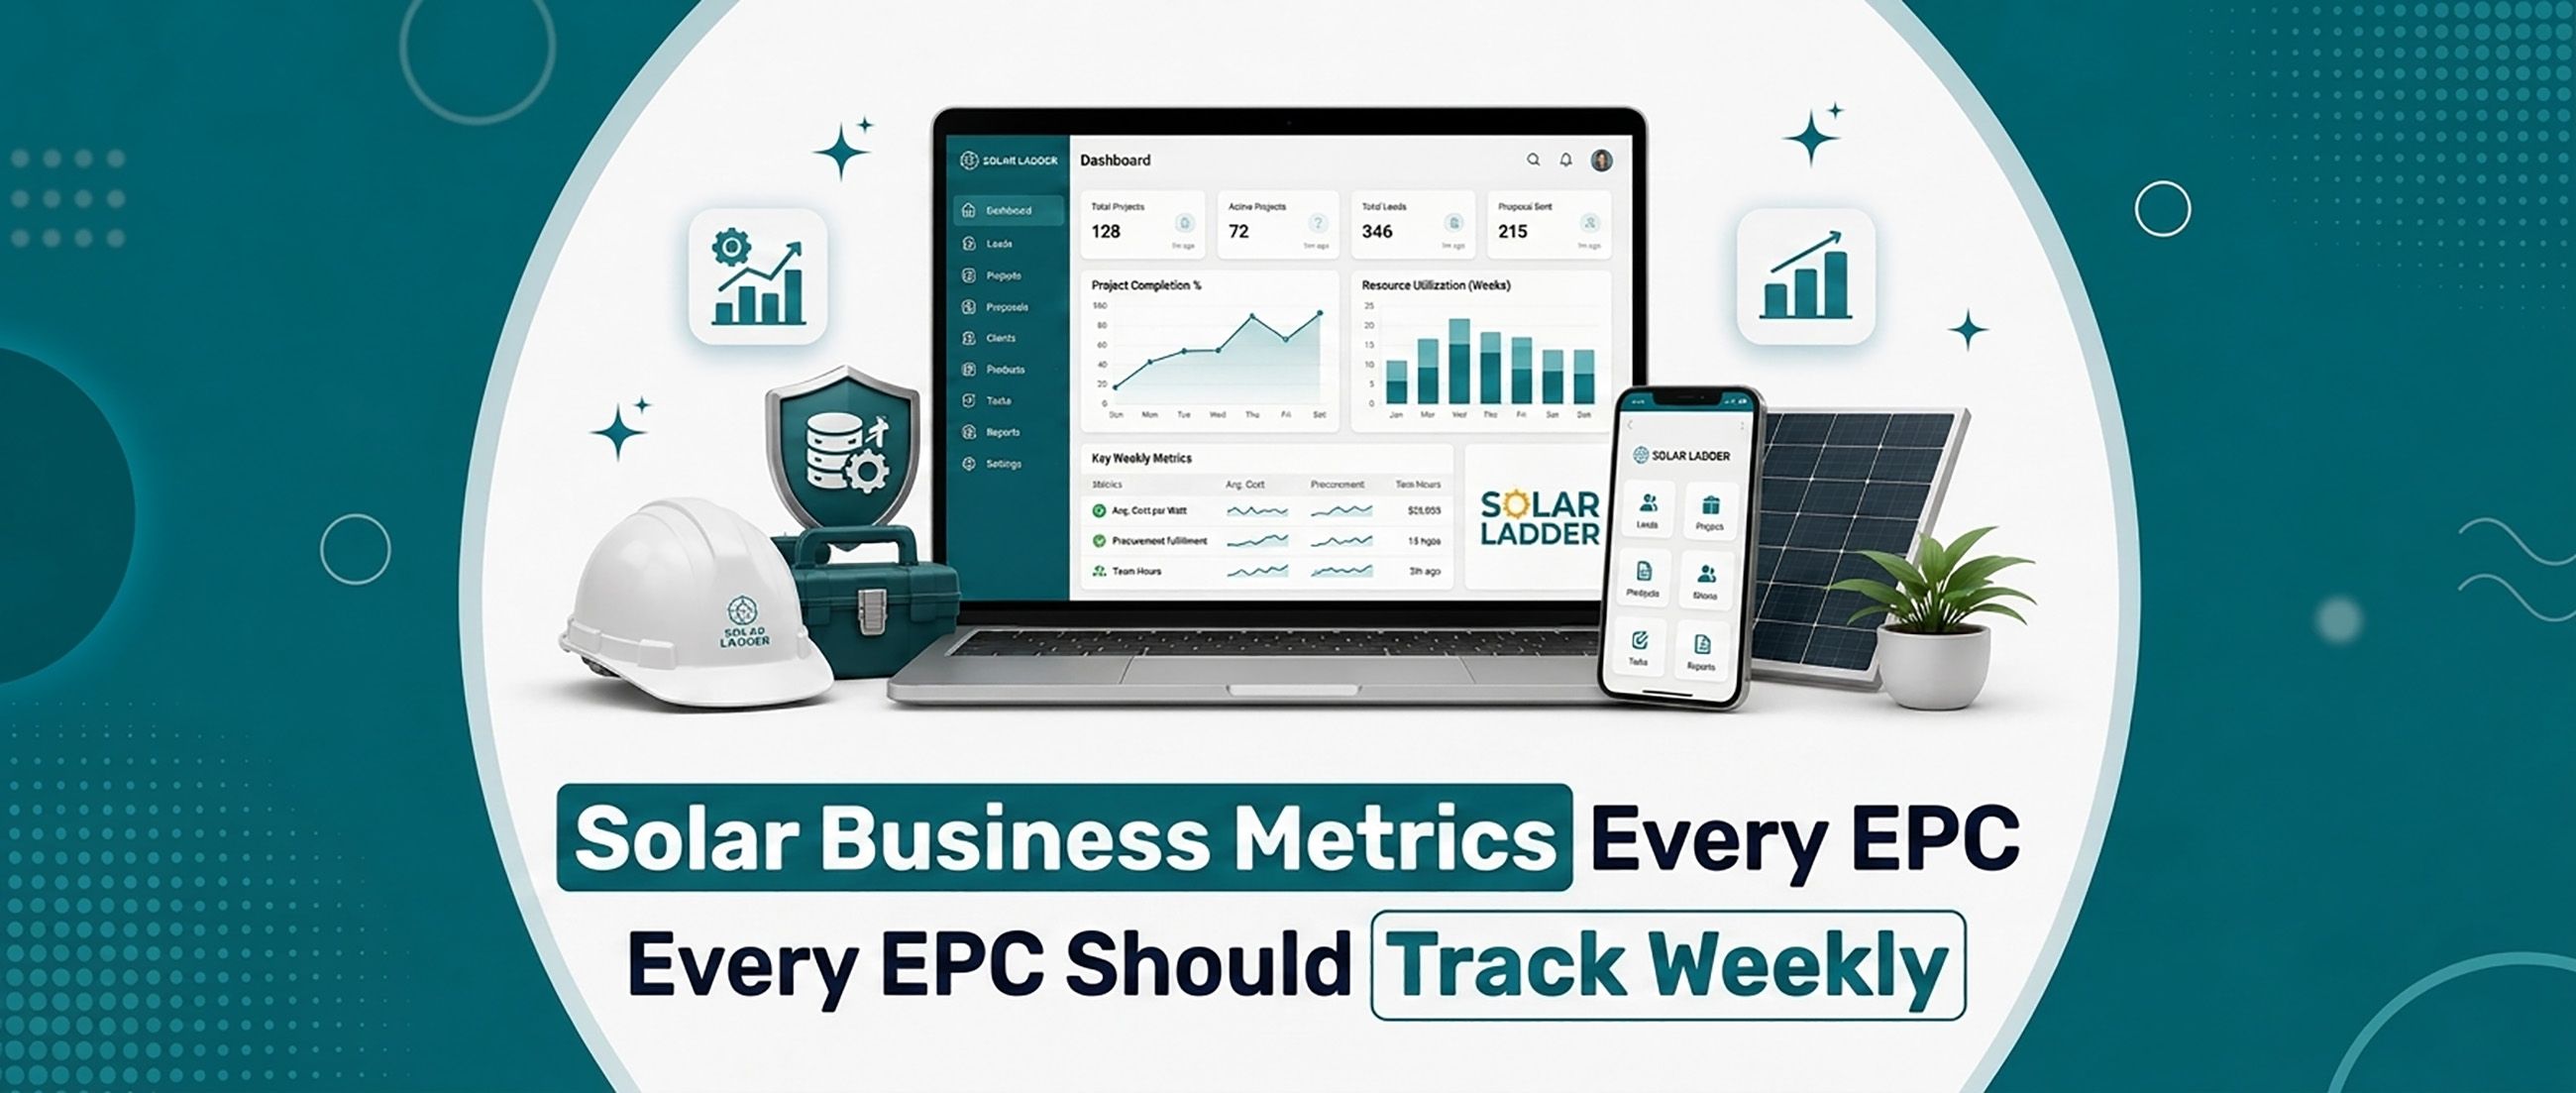
TL;DR Growing Solar EPC companies cannot rely only on revenue numbers to understand business performance. Tracking weekly metrics across sales, projects, operations, and customer service helps owners identify bottlenecks early and make better decisions. By using a centralized platform like Solar Ladder, EPC companies can monitor leads, conversions, project progress, installation efficiency, plant performance, and customer service from one dashboard.
Solar Business Metrics Every EPC Should Track Weekly
Many Solar EPC owners review only one number:
How much revenue did we generate this month?
While revenue is important, it only shows the final outcome.
It does not explain:
- Why sales are slowing down.
- Why projects are getting delayed.
- Why customers are waiting longer.
- Why installation teams are underperforming.
- Where leads are getting lost.
Successful solar companies understand that growth is built through hundreds of small improvements.
The best way to identify those improvements is by tracking the right business metrics every week.
A weekly dashboard gives Solar EPC owners visibility into what is working, what is failing, and where immediate action is required.
Why Weekly Tracking Matters for Solar EPC Companies
The solar industry has multiple moving parts:
- Lead generation
- Sales follow-ups
- Site surveys
- Designing
- Proposal generation
- Procurement
- Installation
- Commissioning
- O&M support
A delay at one stage affects the entire business.
For example:
A sales team may generate enough leads, but if follow-ups are delayed, conversions drop.
A project team may win projects, but if procurement is slow, installations get delayed.
Without tracking metrics, owners only see problems after they become expensive.
Weekly tracking helps businesses become proactive instead of reactive.
1. New Leads Generated Per Week
The first metric every Solar EPC should track is lead volume.
Monitor:
- Total enquiries received
- Lead source
- Location-wise leads
- Residential vs commercial leads
- Qualified vs unqualified leads
Lead sources may include:
- Google Ads
- Meta Ads
- IndiaMART
- Website enquiries
- Referrals
- Exhibitions
This helps owners understand whether marketing efforts are generating enough opportunities.
2. Lead Response Time
Getting leads is only half the battle.
The speed at which your team responds directly impacts conversions.
Track:
- Average response time
- Leads contacted within 5 minutes
- Pending first responses
- Missed follow-ups
A fast response increases the chances of connecting with customers while their interest is high.
3. Lead Conversion Rate
Not every enquiry becomes a project.
Measure:
Number of leads converted into opportunities or customers ÷ Total leads received
Track conversion rates by:
- Salesperson
- Lead source
- Location
- Customer segment
This helps identify which channels and team members are delivering the best results.
4. Sales Pipeline Value
Revenue forecasting becomes easier when you understand your pipeline.
Track opportunities across stages:
- New enquiry
- Qualified lead
- Site survey completed
- Proposal shared
- Negotiation
- Order confirmed
Important metrics include:
- Total pipeline value
- Number of active opportunities
- Expected closing dates
- Stuck deals
A healthy pipeline ensures consistent business growth.
5. Proposal Turnaround Time
Customers today expect quick quotations.
Track:
- Time taken to create proposals
- Number of proposals sent weekly
- Pending proposals
- Proposal acceptance rate
Delays in proposal generation often result in competitors reaching customers first.
Modern Solar EPC companies use tools like instant proposal generators to reduce turnaround time.
6. Sales Team Performance
Owners should understand how effectively their sales team is working.
Track:
- Leads assigned per salesperson
- Calls completed
- Follow-ups completed
- Site surveys booked
- Proposals generated
- Deals closed
This allows managers to coach teams using data instead of assumptions.
7. Project Completion Rate
Once a project is sold, execution becomes critical.
Monitor:
- Projects started
- Projects completed
- Pending installations
- Delayed projects
- Average installation time
This helps identify operational bottlenecks.
8. Installation Team Productivity
For EPC companies managing multiple teams, installation efficiency is essential.
Track:
- Projects completed per team
- Average project completion time
- Site visits completed
- Rework required
- Customer complaints
This helps optimize workforce allocation.
9. Project Delay Reasons
Not all delays are the same.
Track reasons such as:
- Material availability
- Customer approval delays
- Documentation issues
- Labour availability
- Weather conditions
- Grid approval delays
Understanding patterns helps prevent repeated problems.
10. Customer Satisfaction & Service Metrics
A successful solar business continues beyond installation.
Track:
- Customer complaints
- Service response time
- AMC renewals
- Maintenance requests
- Customer feedback
Happy customers lead to:
- More referrals
- Higher AMC revenue
- Better brand reputation
11. Solar Plant Performance Metrics (Post Installation)
For installed systems, monitor:
- Energy generation
- Plant uptime
- Inverter performance
- Fault alerts
- Performance ratio
Remote Monitoring Systems (RMS) help EPC companies identify issues before customers report them.
12. Revenue & Profitability Metrics
Finally, track financial performance.
Important metrics include:
- Weekly revenue generated
- Project profitability
- Cost overruns
- Pending payments
- Collection status
A project that generates revenue but has poor margins can hurt business growth.
Why Solar EPC Companies Need a Centralized Dashboard
Many EPC companies still manage data using:
- Excel files
- WhatsApp groups
- Separate software tools
- Manual reports
This creates problems:
- No single source of truth
- Delayed reporting
- Data errors
- Difficult decision-making
A centralized Solar ERP or CRM platform brings all business information together.
How Solar Ladder Helps EPCs Track Business Metrics
Solar Ladder provides Solar EPC companies with visibility across the entire customer lifecycle.
👥 CRM & Lead Management
Track:
- New leads
- Lead sources
- Follow-ups
- Sales pipeline
- Conversion rates
- Sales team performance
Owners get real-time visibility without depending on manual reports.
📊 Business Dashboards
Monitor important KPIs including:
- Sales performance
- Project status
- Revenue pipeline
- Team productivity
- Customer activities
Make decisions using live business data.
☀️ 3D Solar Design (Laptop & Mobile)
Track design and proposal efficiency with support for:
- RCC rooftops
- Metal sheet roofs
- Shed structures
- Walkways
- Safety features
Reduce delays between customer enquiry and proposal delivery.
📄 Instant Proposals
Improve sales efficiency by tracking:
- Proposal creation time
- Proposal status
- Customer approvals
- Conversion performance
📋 Project Management
Monitor:
- Project milestones
- Installation progress
- Team assignments
- Documentation
- Completion timelines
Manage multiple projects without losing visibility.
📡 RMS & 🔧 O&M
Track post-installation performance through:
- Generation reports
- Fault alerts
- Maintenance schedules
- Service requests
- AMC activities
Maintain long-term customer relationships.
Best Practices for Weekly Solar Business Reviews
- Review dashboards every Monday.
- Track metrics by salesperson and location.
- Identify bottlenecks early.
- Compare weekly trends, not just individual numbers.
- Focus on improvement areas.
- Align sales and operations teams.
- Automate reporting wherever possible.
- Use data to coach teams.
- Celebrate improvements.
- Keep customer satisfaction as a core metric.
Conclusion
Growing a Solar EPC business requires more than selling more projects.
It requires understanding every part of the business—from lead generation and sales performance to project execution and customer service.
Weekly tracking gives owners the visibility needed to identify problems early, improve team performance, and make smarter decisions.
With Solar Ladder, Solar EPC companies can monitor CRM, Lead Management, Sales Performance, 3D Solar Design, Instant Proposals, Project Management, RMS, and O&M from one integrated platform.
The companies that measure their operations consistently are the ones that scale faster.
Frequently Asked Questions
The most important metrics include lead generation, response time, conversion rate, pipeline value, proposal turnaround time, project completion rate, installation productivity, customer satisfaction, and profitability.
Weekly tracking helps identify problems early, improve decision-making, optimize teams, and prevent small issues from becoming major operational challenges.
Solar companies should monitor lead response time, leads generated, site surveys completed, proposals sent, conversion rates, sales pipeline value, and closed deals.
Solar Ladder combines CRM, Lead Management, 3D Solar Design, Instant Proposals, Project Management, RMS, and O&M into one platform, helping Solar EPC companies monitor every stage of business growth.