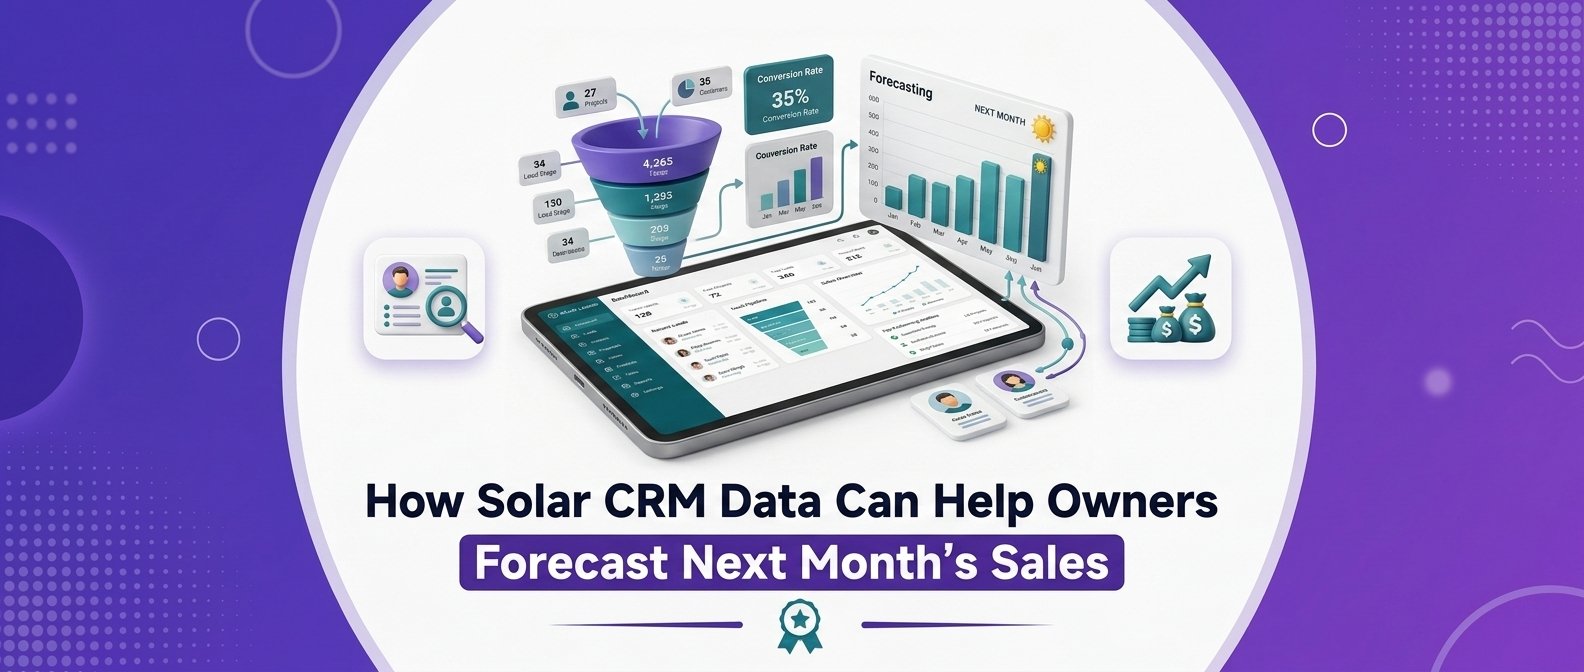
TL;DR Solar CRM data can help EPC owners forecast next month's sales using pipeline value, deal stages, historical conversion rates, average project value, sales cycle, and salesperson performance. Instead of guessing how much revenue will close, owners can use weighted pipeline data to identify likely sales, spot pipeline gaps early, and plan marketing, inventory, manpower, and cash flow more effectively.
How Solar CRM Data Can Help Owners Forecast Next Month's Sales
For many Solar EPC owners, sales forecasting still looks something like this:
"We have around 20 leads. I think we'll close 5–6 deals next month."
The problem is that this isn't really a forecast.
It's a guess.
As a solar business grows, guessing becomes increasingly risky. An EPC owner needs to know how much revenue is likely to come in, whether the sales team has enough opportunities, which deals are most likely to close, and where the pipeline needs attention.
This is where Solar CRM data becomes valuable.
A CRM doesn't just store customer names and phone numbers. When used properly, it creates a historical record of how leads move through the sales process.
That data can help owners identify patterns and build a more realistic forecast for the coming month.
What Is Sales Forecasting for a Solar EPC?
Sales forecasting is the process of estimating how much business your company is likely to close during a future period.
For a Solar EPC, that could mean forecasting:
- Number of deals
- System capacity sold
- Revenue
- Average project value
- Expected closures
- Lead requirements
- Salesperson performance
For example:
"Based on our current pipeline and historical conversion rates, we expect to close approximately ₹45 lakh worth of projects next month."
That's much more useful than:
"I think next month will be good."
The objective isn't to predict the future perfectly.
It's to make better business decisions using the information already available.
Why Solar CRM Data Is Useful for Forecasting
Every sales interaction creates information.
A CRM can capture:
Lead Source → Lead → Contacted → Qualified → Site Survey → Proposal → Negotiation → Won/Lost
Over time, these stages create a dataset.
That dataset can answer questions such as:
- How many leads do we usually need for 10 sales?
- Which lead sources convert best?
- How long does a typical deal take?
- How many proposals convert into orders?
- Which salesperson closes the most?
- What is our average project value?
- How much pipeline do we need to hit our target?
- Which deals are most likely to close next month?
This turns CRM from a record-keeping tool into a sales intelligence system.
1. Start With Your Current Sales Pipeline
The first step in forecasting is understanding what is already in your pipeline.
Suppose an EPC has:
Pipeline Stage
Number of Deals
Potential Value
New Leads
50
₹75 lakh
Qualified
25
₹45 lakh
Site Survey
15
₹30 lakh
Proposal Sent
12
₹24 lakh
Negotiation
7
₹15 lakh
At first glance, the company has a ₹1.89 crore pipeline.
But that does not mean it will generate ₹1.89 crore next month.
Different stages have different probabilities of conversion.
2. Use Historical Conversion Rates
This is where historical CRM data becomes powerful.
Imagine your historical data shows:
- 100 leads → 40 qualified opportunities
- 40 opportunities → 25 site surveys
- 25 site surveys → 18 proposals
- 18 proposals → 6 sales
Your sales team can use these historical conversion rates to estimate future results.
For example, if you currently have 18 proposals in the pipeline and your historical proposal-to-sale conversion rate is 33%, you might expect approximately:
18 × 33% = 6 potential sales
This is not a guarantee.
But it is a much more informed estimate than simply counting leads.
3. Track Proposal-to-Sale Conversion
For Solar EPCs, proposals are particularly important because they represent a much stronger buying signal than a raw lead.
Suppose your CRM shows:
January: 20 proposals → 6 sales
February: 25 proposals → 8 sales
March: 30 proposals → 9 sales
Your approximate proposal-to-sale conversion is around 30%.
Now imagine your team has 40 active proposals heading into next month.
That provides a useful forecasting signal.
Instead of saying:
"We have 40 proposals."
you can ask:
"Historically, how many of these proposals are likely to become customers?"
4. Measure Average Deal Value
Sales forecasting isn't only about the number of deals.
It's also about their value.
Suppose your team closes:
- 5 projects worth ₹3 lakh each
- 3 projects worth ₹7 lakh each
- 2 projects worth ₹12 lakh each
That's 10 projects, but the revenue impact varies dramatically.
Your CRM should therefore track average deal value.
For example:
Average project value = ₹6 lakh
If your forecast suggests 10 deals next month:
10 × ₹6 lakh = ₹60 lakh potential revenue
This gives the owner a starting point for revenue forecasting.
5. Track Sales Cycle Length
Solar purchases don't always happen immediately.
A customer may take:
- 2 days to respond
- 1 week to complete a site survey
- 5 days to review a proposal
- 2 weeks to compare vendors
- another week to arrange financing
Therefore, sales forecasting needs to consider time.
Your CRM can help determine the average time between:
Lead Created → Qualified
Qualified → Site Survey
Site Survey → Proposal
Proposal → Won
Suppose your historical data shows that the average sales cycle is 21 days.
A proposal created on August 5 may have a reasonable chance of closing during August.
But a new lead created on August 28 may be more likely to close in September.
This distinction is critical for monthly forecasting.
6. Look at Deal Age
Not every old opportunity is a good opportunity.
Suppose you have:
10 proposals created this week
and
15 proposals created 90 days ago
It would be dangerous to assume all 25 have equal closing potential.
Old deals may indicate:
- Customer is delaying
- Customer selected another EPC
- Budget issue
- Poor follow-up
- Proposal needs revision
- Customer is no longer interested
CRM data allows owners to identify these aging opportunities.
7. Create a Weighted Sales Forecast
One useful approach is to assign a probability to every pipeline stage.
For example:
Stage
Probability
New Lead
5%
Qualified
15%
Site Survey
30%
Proposal Sent
50%
Negotiation
75%
Verbal Confirmation
90%
Now imagine your pipeline looks like this:
Stage
Pipeline Value
Probability
Weighted Value
Qualified
₹20L
15%
₹3L
Site Survey
₹15L
30%
₹4.5L
Proposal
₹25L
50%
₹12.5L
Negotiation
₹10L
75%
₹7.5L
Your total pipeline is:
₹70 lakh
But the weighted forecast is:
₹27.5 lakh
That provides a much more realistic picture of potential near-term revenue.
8. Forecast by Salesperson
A Solar EPC owner also needs to know who is likely to deliver the revenue.
Imagine your team has three salespeople:
Salesperson
Active Pipeline
Historical Conversion
Forecast
Salesperson A
₹40L
35%
₹14L
Salesperson B
₹30L
25%
₹7.5L
Salesperson C
₹20L
40%
₹8L
The total pipeline is ₹90 lakh.
But the expected revenue based on historical conversion is approximately ₹29.5 lakh.
This helps owners understand both:
What the company might sell
and
Who is likely to deliver it.
9. Forecast by Lead Source
One of the most useful things a CRM can reveal is which marketing channels actually produce revenue.
Consider this example:
Lead Source
Leads
Deals Won
Revenue
Google Ads
150
12
₹42L
Meta Ads
200
8
₹24L
IndiaMART
100
10
₹30L
Referrals
40
12
₹48L
At first glance, Meta generated the most leads.
But referrals generated the most revenue per lead.
This changes how the owner should think about marketing investment.
The goal isn't necessarily:
"Which channel gives me the most leads?"
It's:
"Which channel gives me the most valuable customers?"
10. Track Lost Deals Too
A common mistake is using CRM data only for successful deals.
Lost deals contain valuable forecasting information.
Track why deals were lost:
- Price too high
- Competitor selected
- Customer postponed
- Financing issue
- No response
- Site unsuitable
- Project cancelled
- Poor follow-up
- Customer chose a cheaper system
If 30% of lost deals are consistently caused by pricing, for example, the owner may need to examine positioning, proposal value, financing options, or sales messaging.
Lost-deal data can therefore improve future forecasts as well as future sales performance.
11. Monitor Pipeline Coverage
Suppose your sales target for next month is:
₹50 lakh
Your historical close rate is approximately:
25%
A simple pipeline coverage approach would suggest that you need substantially more than ₹50 lakh in active opportunities to have a reasonable chance of achieving the target.
For example:
₹50L ÷ 25% = ₹2 crore pipeline
This doesn't mean exactly ₹2 crore will convert.
It means the team needs sufficient pipeline coverage to support the target.
This is one of the most important numbers an EPC owner can monitor.
12. Identify Pipeline Gaps Before the Month Starts
Imagine your owner target is:
₹1 crore next month
But your weighted pipeline currently suggests:
₹55 lakh
That's a problem you can identify before the month begins.
The management team can then take action:
- Generate more leads
- Reactivate old leads
- Increase follow-ups
- Run a targeted campaign
- Contact dormant proposals
- Push referrals
- Improve salesperson activity
- Offer financing
- Re-engage lost opportunities
Without CRM data, the owner may only discover the problem at the end of the month.
13. Use CRM Data to Forecast Lead Requirements
Forecasting doesn't stop at revenue.
Suppose your business needs:
10 additional sales
Your historical data shows:
100 qualified leads → 20 sales
You therefore need approximately:
50 qualified leads
to target 10 additional sales.
If only 25 qualified leads are currently in the pipeline, marketing and sales need to generate more opportunities.
This connects:
Sales Target → Conversion Rate → Lead Requirement → Marketing Budget
That's much more useful than setting a marketing target based purely on lead volume.
14. Forecast System Capacity, Not Just Revenue
Solar EPCs can also use CRM data to forecast installation requirements.
For example, if the pipeline indicates that next month's likely bookings are:
- 5 × 3 kW
- 8 × 5 kW
- 4 × 10 kW
The owner can estimate approximately:
15 kW + 40 kW + 40 kW = 95 kW
of potential installations.
That can help the operations team prepare for:
- Modules
- Inverters
- Structures
- Labour
- Installation teams
- Procurement
- Working capital
Sales forecasting can therefore support operational planning, not just revenue planning.
15. Connect Forecasting With Cash Flow
Solar projects often involve significant working capital.
If the sales team expects a strong month ahead, management may need to prepare for:
- Equipment purchases
- Inventory
- Installation labour
- Logistics
- Project expenses
CRM forecasting can therefore become an input into financial planning.
A forecast that says:
"We expect ₹80 lakh in new bookings"
is useful.
But a more complete forecast asks:
"How much will be booked, when will the projects start, and what working capital will we need?"
What Solar CRM Dashboard Should an Owner Monitor?
A Solar EPC owner doesn't need hundreds of metrics.
A practical dashboard can focus on:
Sales Pipeline
- Total pipeline value
- Weighted pipeline value
- Number of active opportunities
- Pipeline by stage
Conversion
- Lead-to-qualified conversion
- Qualified-to-proposal conversion
- Proposal-to-sale conversion
- Overall win rate
Revenue
- Current-month sales
- Next-month forecast
- Average deal value
- Revenue by salesperson
Sales Activity
- New leads
- Calls
- Follow-ups
- Site surveys
- Proposals sent
Pipeline Health
- Aging opportunities
- Overdue follow-ups
- Stalled deals
- Lost opportunities
Marketing
- Leads by source
- Deals by source
- Revenue by source
- Cost per acquisition
How Solar Ladder Helps With Sales Forecasting
Solar Ladder's CRM and sales-management features help Solar EPCs centralize the information required to understand their sales pipeline.
Instead of keeping leads, follow-ups, proposals, and deal stages in separate systems, teams can manage the customer journey within a connected platform.
Solar Ladder's solar CRM guide explains how a dedicated CRM can help EPCs manage leads, follow-ups, sales stages, and customer information.
Lead Management
Track where every opportunity came from and what stage it is currently in.
Sales Pipeline
See opportunities across stages such as:
New Lead → Qualified → Site Survey → Proposal → Negotiation → Won/Lost
Follow-Up Tracking
Identify overdue and upcoming follow-ups so opportunities don't silently disappear from the pipeline.
Salesperson Performance
Compare activity, opportunities, conversion, and revenue across team members.
Proposal Tracking
Understand how many proposals have been created, sent, followed up, and converted.
Project Value
Track deal values and use historical project sizes to improve revenue forecasting.
Management Dashboard
Give owners a consolidated view of pipeline health instead of relying on individual salesperson updates.
A Simple Solar Sales Forecasting Formula
A basic forecasting model can be:
Forecast Revenue = Active Pipeline × Historical Conversion Rate
For example:
₹1.5 crore active pipeline × 30% conversion = ₹45 lakh forecast
You can make this more accurate by considering:
- Deal stage
- Deal age
- Salesperson
- Historical conversion
- Expected close date
- Lead source
- Average deal value
A weighted pipeline model is generally more useful than applying one conversion rate to every opportunity.
Example: Forecasting Next Month's Solar Sales
Imagine an EPC starts the month with:
₹1 crore pipeline
After reviewing CRM data:
- ₹20L in early-stage opportunities
- ₹25L in site surveys
- ₹35L in proposals
- ₹20L in negotiations
Historical probabilities:
- Early stage: 10%
- Site survey: 30%
- Proposal: 50%
- Negotiation: 75%
The forecast becomes:
₹20L × 10% = ₹2L
₹25L × 30% = ₹7.5L
₹35L × 50% = ₹17.5L
₹20L × 75% = ₹15L
Weighted forecast = ₹42 lakh
Now the owner has a much clearer picture.
The business doesn't simply have a ₹1 crore pipeline.
It has approximately ₹42 lakh of weighted potential, based on the assumptions above.
Common Solar Sales Forecasting Mistakes
1. Counting Every Lead as Revenue
A lead is not a sale.
2. Treating Every Opportunity Equally
A new lead and a customer negotiating the final price do not have the same probability of closing.
3. Ignoring Deal Age
Old opportunities can distort the pipeline.
4. Not Tracking Lost Deals
Lost opportunities contain valuable information about conversion patterns.
5. Forecasting Only at Month-End
Forecasting should be continuous.
6. Ignoring Sales Cycle Length
A deal expected to close next month may not actually have enough time to progress through the pipeline.
7. Forecasting Only Revenue
System capacity, procurement, cash flow, and installation requirements also matter.
8. Relying Entirely on Salesperson Estimates
Salespeople naturally have different interpretations of how likely a deal is to close.
Historical CRM data provides an additional, more objective perspective.
How to Make Solar Sales Forecasting More Accurate
Keep CRM Data Clean
Incorrect stages and outdated deals will produce poor forecasts.
Define Clear Pipeline Stages
Every salesperson should use the same stage definitions.
Make Close Dates Mandatory
Every active opportunity should have an expected closing period.
Review Aging Deals
Don't allow old opportunities to remain indefinitely in the pipeline.
Track Historical Conversion
Measure actual conversion at each stage.
Track Lead Sources
Know which channels generate actual sales.
Review Forecast vs Actual
At the end of every month, compare:
Forecasted Sales vs Actual Sales
Then adjust your assumptions.
Build Forecasts by Salesperson
Individual conversion rates can vary significantly.
The Real Value of Solar CRM Data
The biggest benefit of CRM data isn't simply that it tells you what happened last month.
It helps you answer:
"What is likely to happen next?"
That distinction matters.
Historical data tells you:
We closed 20 deals last month.
A properly managed CRM can help you understand:
We currently have 35 active opportunities, ₹1.2 crore in pipeline, ₹48 lakh in weighted potential, and enough qualified opportunities to potentially reach next month's target.
That is actionable information.
Conclusion
Sales forecasting doesn't have to be guesswork.
For Solar EPC owners, the CRM already contains many of the signals needed to build a better forecast:
- Lead volume
- Pipeline value
- Deal stage
- Conversion rates
- Sales cycle
- Proposal volume
- Average project value
- Salesperson performance
- Lead source
- Deal age
- Historical closures
When these metrics are consistently tracked, owners can move from:
"I think we'll have a good month."
to:
"Based on our current pipeline and historical performance, this is what we're likely to close—and this is what we need to do to hit our target."
That is the real power of Solar CRM data.
For growing EPCs, CRM should not be treated simply as a database of customer information.
It should become a sales intelligence system that helps management make better decisions about marketing, sales hiring, inventory, working capital, installation capacity, and revenue targets.
With Solar Ladder, Solar EPCs can connect lead management, CRM, sales pipelines, follow-ups, proposals, project management, RMS, and O&M in one platform—giving owners greater visibility from the first lead through the completed project and beyond.
Frequently Asked Questions
A CRM cannot guarantee future sales, but historical CRM data can be used to build a more informed forecast based on pipeline value, conversion rates, deal stages, sales cycles, and historical performance.
Important metrics include pipeline value, weighted pipeline, conversion rates, average deal value, sales cycle, proposal-to-sale conversion, deal age, lead source, and salesperson performance.
A weighted pipeline assigns a probability to each sales opportunity based on its stage or historical likelihood of conversion. This produces an estimated value rather than treating every opportunity as equally likely to close.
Solar Ladder provides CRM, lead management, pipeline tracking, follow-up management, proposal tracking, and sales visibility, giving EPC owners the data needed to monitor pipeline health and make more informed sales forecasts.